- Table of Contents
Types of Business Analytics
One Business, Four Analytics Types: A Complete Walkthrough
Descriptive vs. Diagnostic vs. Predictive vs. Prescriptive Analytics
Which Type of Analytics Should You Start With?
Skills Needed for Each Type of Business Analytics
Industries Using Each Type of Business Analytics
Common Challenges in Implementing Business Analytics
FAQs about Business Analytics Types
Share This Article
Business analytics helps companies understand their data and make better decisions. Instead of guessing, businesses now use data to find what is working and what is not. From tracking past performance to predicting future trends, business analytics plays an important role in every industry.
There are different types of business analytics, and each one serves a unique purpose. Some focus on analyzing past data, while others help in forecasting or suggesting the next best action. In this blog, we will explore the main types of business analytics in a simple way with examples.
Types of Business Analytics
Before we go deep into each type, here is a quick summary of the 4 types of business analytics: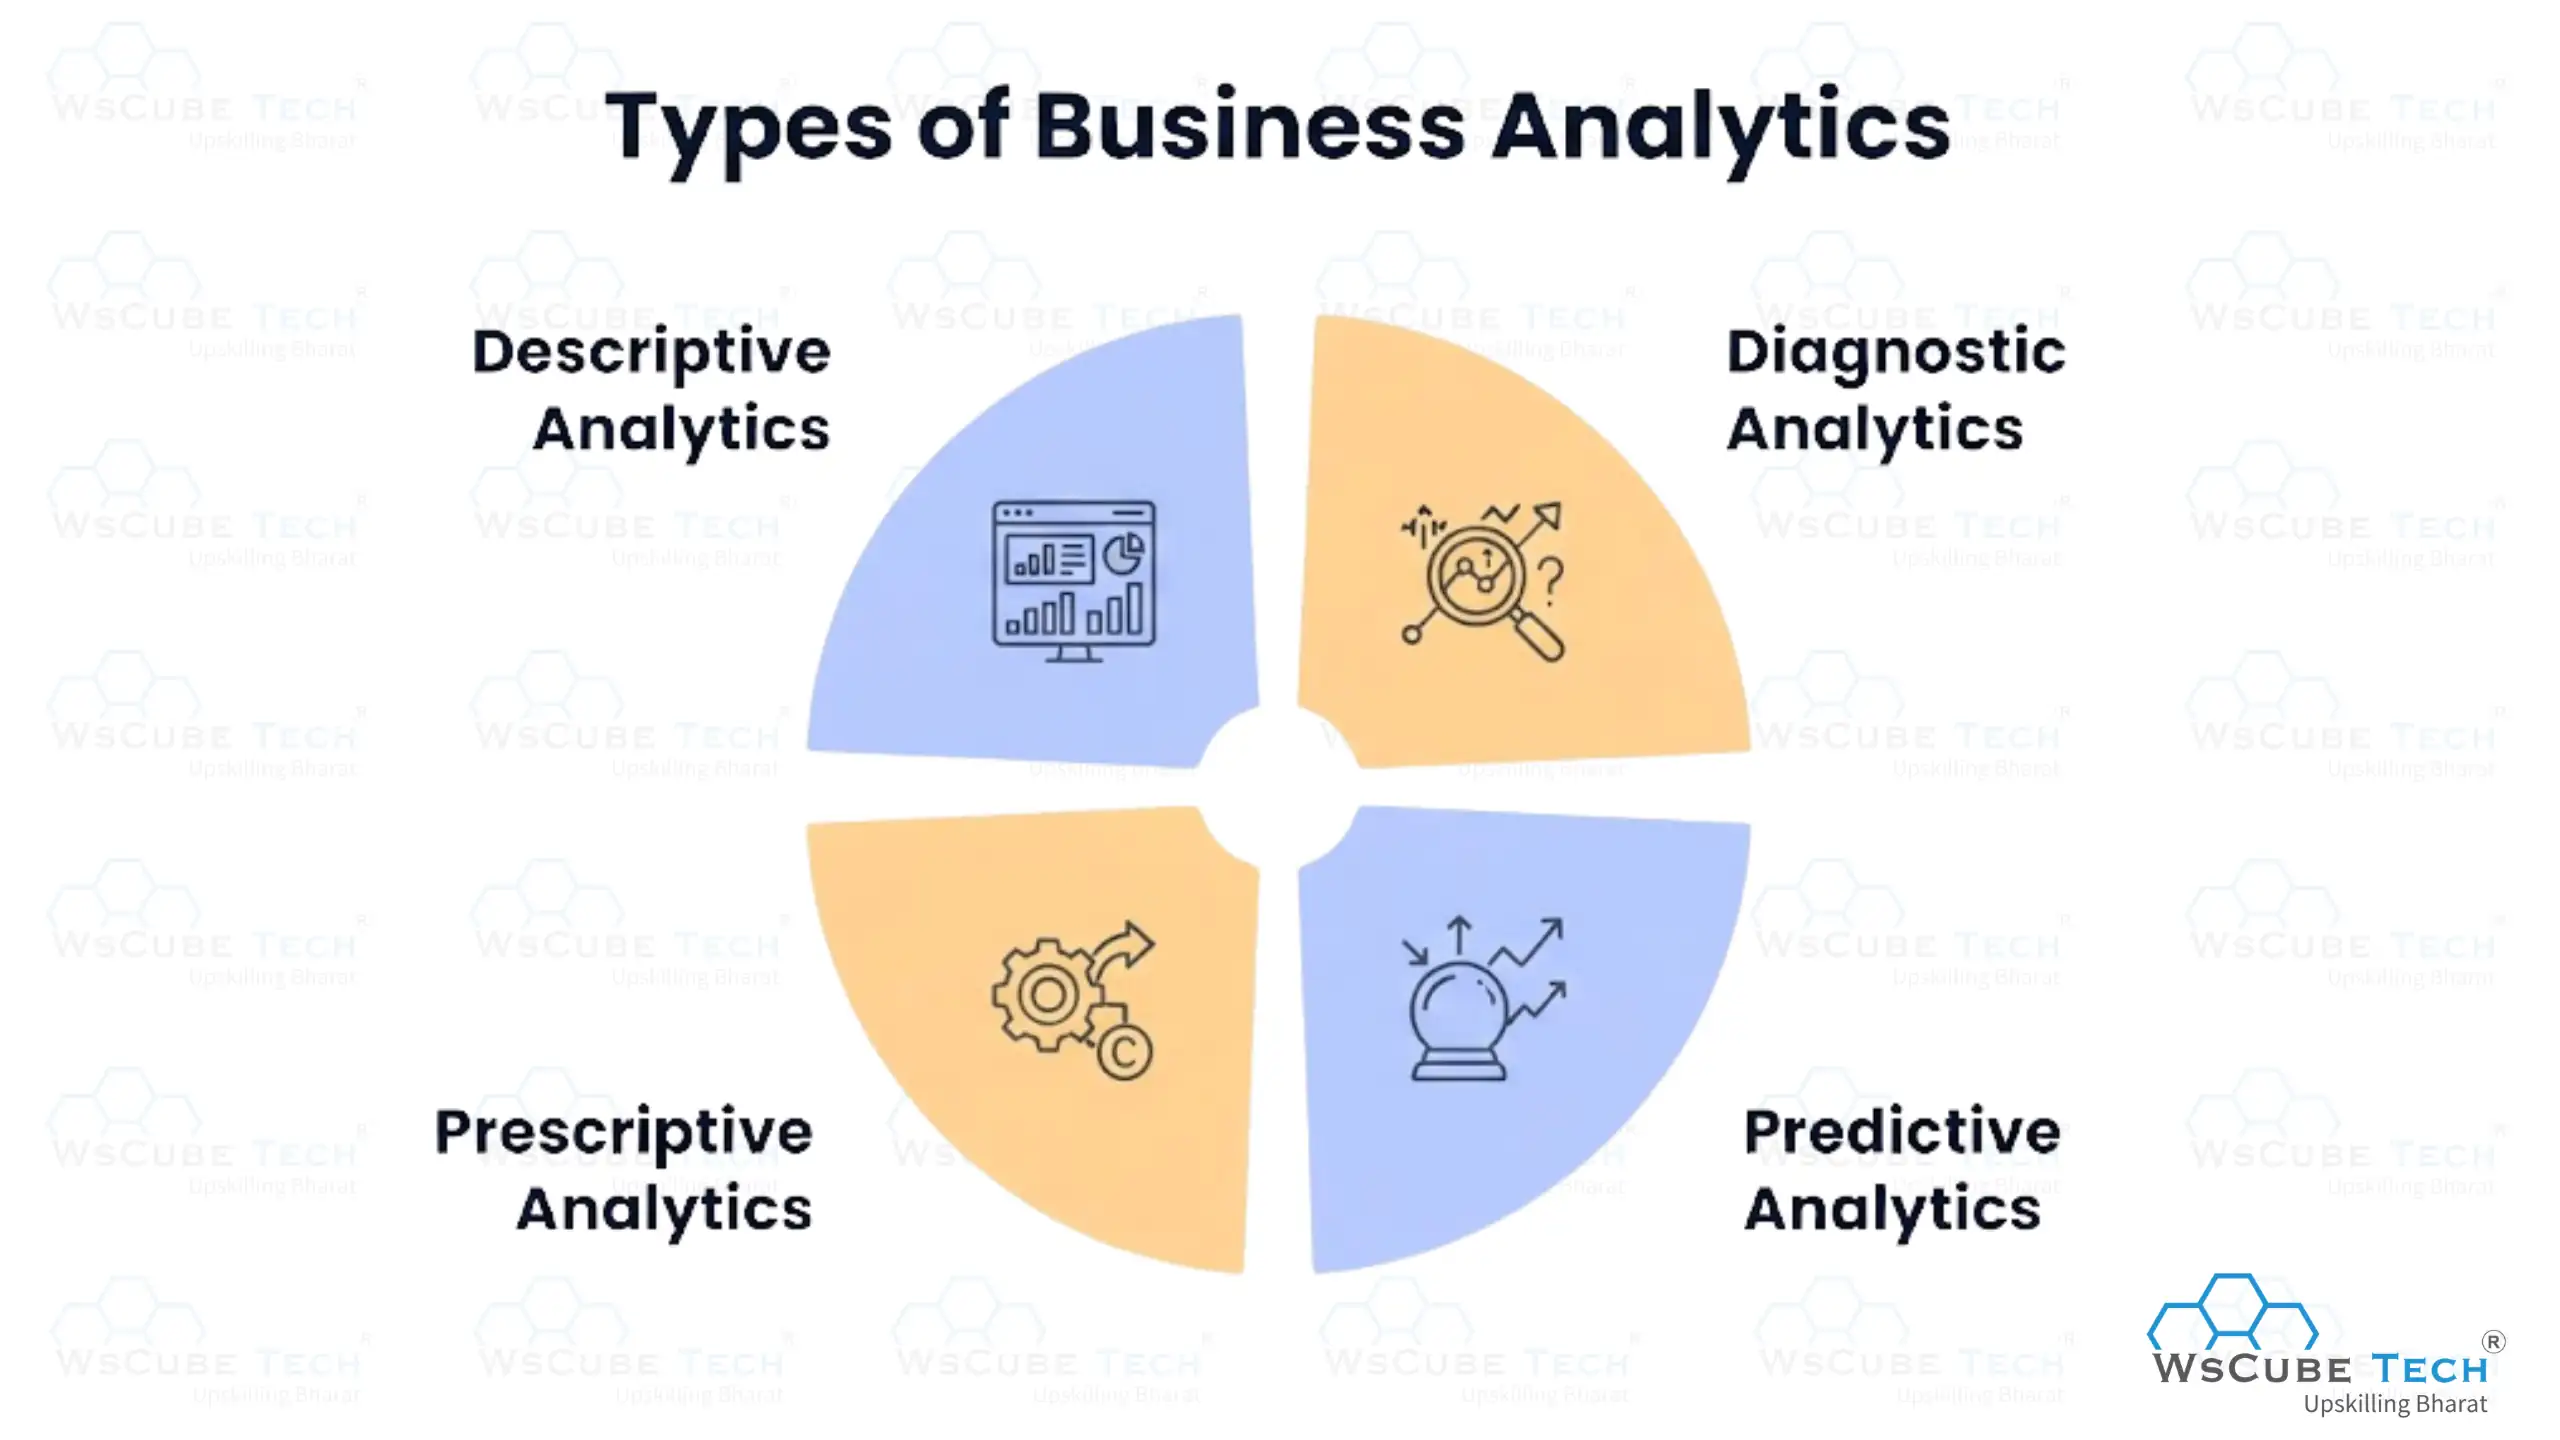
Descriptive Analytics – Looks at past data to understand what happened.
Diagnostic Analytics – Digs deeper into the data to understand why it happened.
Predictive Analytics – Uses historical patterns to forecast what will happen next.
Prescriptive Analytics – Recommends what action should be taken based on the data.
Think of these four types as steps on a ladder. Descriptive analytics is the starting point, and prescriptive analytics is the most advanced stage. Most companies begin with descriptive analytics and slowly move as their data maturity grows.
In fact, descriptive analytics still hold the largest share of the analytics market, at around 26 to 32 percent of total revenue. This shows that a large number of businesses are still at the early stage of their analytics journey. Now let us look at each type of business analytics in detail.
If you want to start your career in this field, you can join the Business Analytics Course by WsCube Tech, which includes practical training, internship, and placement support.
1. Descriptive Analytics: What Happened?
Descriptive analytics is the most basic and most widely used form of business analytics. It focuses on summarizing historical data to understand what has already taken place in a business. It does not try to explain causes or predict the future. It simply presents facts in an organized and readable way, usually through charts, graphs, dashboards, and reports.
For example, a monthly sales report that shows how many products were sold in each region is a form of descriptive analytics. It tells you the numbers, but not the reasons behind them.
How It Works
Descriptive analytics works by collecting raw data from different sources such as sales systems, websites, customer databases, or social media platforms. This data is then cleaned, organized, and summarized using basic statistical methods like averages, totals, percentages, and counts.
The process usually follows these steps:
Data is collected from internal systems like CRM, ERP, or POS software
The data is cleaned to remove errors, duplicates, or missing values
Data is aggregated and summarized using simple formulas
The results are displayed through dashboards, charts, or reports
The goal is to make raw numbers easy to read and understand, so that managers and teams can quickly see performance trends without needing to analyze anything themselves.
Tools Used (Tableau, Power BI, Qlik)
Some of the most popular tools for descriptive analytics include Tableau, Power BI, and Qlik. These tools are designed to turn spreadsheets full of numbers into visual dashboards that anyone can understand, even without a technical background.
Tableau is known for its strong data visualization features and drag and drop interface, making it a favorite for building interactive dashboards.
Power BI, developed by Microsoft, integrates well with Excel and other Microsoft products, which makes it a common choice for businesses already using Microsoft tools.
Qlik stands out for its associative data model, which allows users to explore data freely instead of following a fixed path.
Real-World Example: Retail Sales Analysis
Imagine a retail company that operates 50 stores across India. At the end of each month, its management team wants to understand how the business performed. Using descriptive analytics, the company creates a dashboard that shows: